Newsletter: February 2025
Skylims & BI: Empowering Data-Driven Decisions
In today's healthcare landscape, data-driven decision-making is essential. Medical laboratories play a vital role in generating and storing vast amounts of data through their Laboratory Information System (LIS). This data is invaluable for healthcare systems, but can also contribute significantly to efficient laboratory management, medical research, and identifying population health trends.

While Excel is commonly used to manage this data, it has limitations with large datasets, automation and generating interactive insights. Business Intelligence tools like Power BI enhance reporting and data analysis by effortlessly integrating with Skylims, converting unprocessed data into meaningful reports, providing consumers valuable information and insights.
In this newsletter, we explore some known benefits of analytics for lab management.
The Benefits of Business Intelligence Reports
Business Intelligence enables laboratory managers to unlock a range of benefits through these reports and data insights. It provides:
-
Timely insights: Reports are updated on a daily or monthly basis, ensuring lab managers are working with the most relevant and up-to-date data available.
-
Improved decision-making: With powerful visualizations and analysis tools, managers can easily identify trends, areas for improvement, and make data-driven decisions with confidence.
-
Operational efficiency: By highlighting bottlenecks, inefficiencies, and underperforming areas, Business Intelligence tools like Power BI enable labs to streamline workflows and optimize resource utilization.
-
Better patient care: Faster decision-making and improved operational performance contribute to more accurate and timely test results, directly impacting patient outcomes.
-
Cost savings: By optimizing inventory, reducing errors, and improving productivity, these tools help labs reduce waste and improve profitability.
"Laboratories can harness the transformative potential of BI and analytics solutions to expedite their progression towards efficiency, innovation, and excellence, lowering cost and improving quality of care" (Mansoor & Dar, 2024, p. 34).
Report and Analytics Examples for Lab Management
1. Test Turnaround Time (TAT) Reports
Labs can track Test Turnaround Times (TAT) for various tests to identify inefficiencies and reduce TAT, improving client satisfaction and operational efficiency.
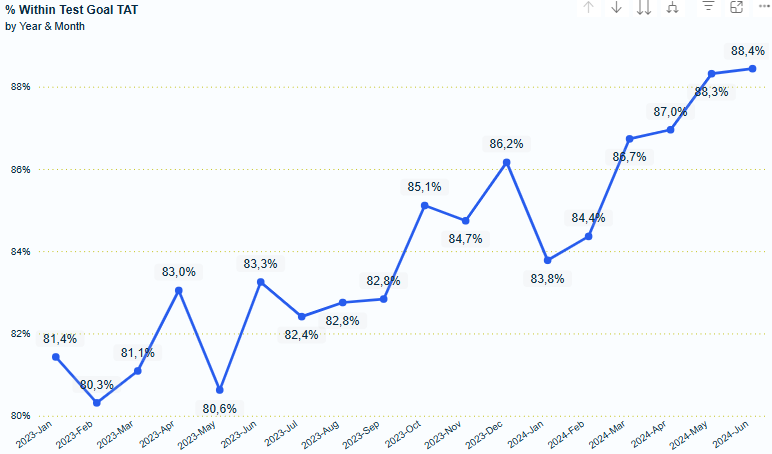
Real-life example: A client identified a lab at which their TAT had lengthened over time without a known cause. Analysing their samples' pre-analytical, analytical and post-analytical journey enabled them to identify and address a root cause for the delays.
2. Staff Productivity and Performance
Tracking staff performance metrics such as test volumes and accuracy enable lab managers to assess effectiveness and optimize resource allocation.
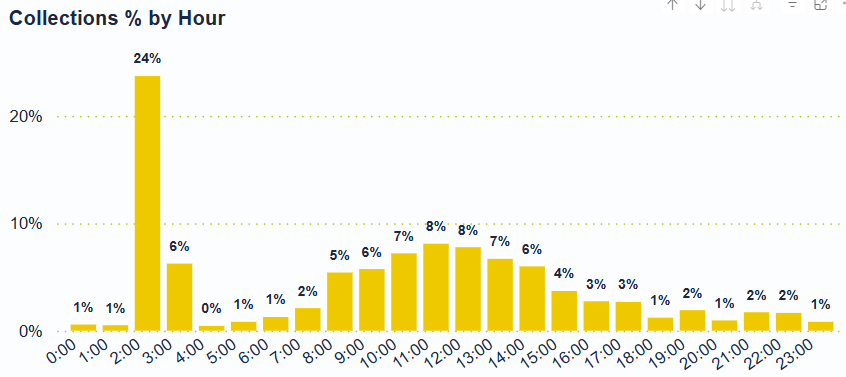
3. Patient and Test Volume Analysis
Analyzing patient and test volume trends helps labs forecast demand and efficiently allocate resources, preparing for peak periods.
4. Inventory Management and Utilization
Generating reports on stock levels and usage rates helps prevent waste, ensuring optimal inventory management without overordering.
5. Quality Control and Accuracy Reports
Monitoring quality control data ensures early detection of test accuracy issues, helping labs maintain high testing standards.
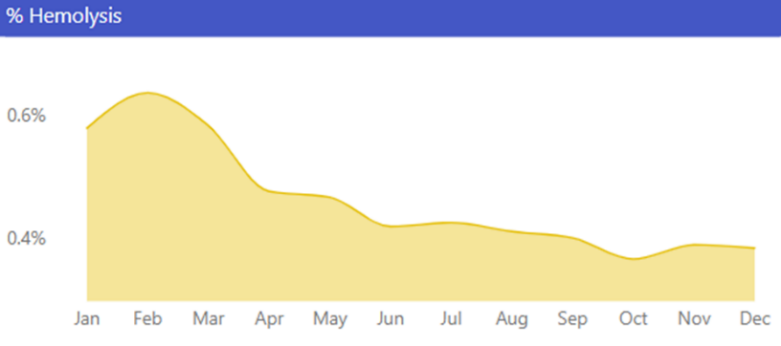
Real-life example: Sample hemolysis rates exceeded acceptable levels at a client's laboratory sites. Analysis identified areas requiring attention, and helped to distinguish factors beyond the sites' control, such as the age of the population served, from those which could be improved with interventions like staff training.
6. Revenue Analysis
Integrating financial data allows labs to track revenue and costs, providing insights into billing trends and opportunities for cost savings.
7. Predictive Analytics for Resource Management
Analyzing historical data enables labs to predict future testing volumes and staffing needs, assisting with proactive resource planning.
Conclusion
Business Intelligence tools have the ability to pull data from your LIS system and create dynamic, visual reports which enables lab managers to make data-driven decisions, from tracking test turnaround times to optimizing resources and ensuring compliance. This empowers labs to enhance operations, improve patient care, and drive efficiency—surpassing the limitations of traditional Excel sheets.
"An integrated R-based business intelligence (BI) tool can be developed to increase the efficiency of the medical validation process by digitalizing steps that were previously done manually in Excel worksheets (Degen et al., 2020)."
Contact Us for a Demo
If you are interested in discovering how our business intelligence tools can improve your operations, we invite you to contact us for a personalized demo. Experience firsthand how BI tools like Power BI integrated with Skylims can provide valuable insights and drive better decision-making.
Reach out today to schedule your demo!
Tel: 012 450 0240
Email: support@mukon.co.za

References:
-
The Differences between Data, Information, and Knowledge - Library & Information Science Education Network
-
Finquelievich, Susana. (2016). Knowledge Society Policy Handbook
-
Ramalingam, S., Subramanian, M., Reddy, A. S., Tarakaramu, N., Khan, M. I., Abdullaev, S., & Dhahbi, S. (2024). Exploring business intelligence applications in the healthcare industry: A comprehensive analysis. Egyptian Informatics Journal, 25, 100438. https://doi.org/10.1016/j.eij.2024.100438
-
Degen, G. A., Günther, V., Holm, J., Bürkle, T., & Sariyar, M. (2020). Using business intelligence tools to support medical validation of laboratory tests. Studies in Health Technology and Informatics, 270, 494-498. https://doi.org/10.3233/SHTI200209
-
Mansoor, I., & Dar, F. J. (2024). Utilizing data analytics and business intelligence tools in laboratory workflow. EJIFCC, 35(1), 34-43. https://doi.org/10.1002/ejifcc.11063783