Newsletter: July 2025
Supporting Lab Efficiency with the QC Dashboard
Maintaining high standards of Quality Control (QC) is critical to the reliability of results. Rule-based alerts and routine reviews can help you easily identify qc violations and act quickly to maintain the high-quality output your clients can rely on, but maintaining a clear view of your laboratory QC statuses can be challenging without a monitoring process in place. To support laboratories in this effort, Skylims provides a built-in QC Dashboard for monitoring QC activities efficiently from a single view.
What does the QC Dashboard Offer?
- Overview of your Lab's QC status: View all flagged issues for your laboratory site in one place
- Detail Lookups: See the details of an issue on the dashboard while investigating a specific case
- Quick Navigation: Access related records without needing to close the main view, including Control Groups, QC Lots, and QC Result details
- Visual Insights: Timeline graphs of QC results are available for flagged analytes, allowing quick access to visual trends when investigating issues
The QC Dashboard presents the following four categories of QC oversight, removing the need to manually track QC events.
| QC Review Overdue | QC Lot Expiration | Rule Violation | Chem Code Run Frequency Exceeded |
|---|---|---|---|
| Missed QC graph reviews. Regular reviewing assists with the prevention of cumulative errors. | Alerts for expired and soon-to-expire in-use lots. | Analytes violating supported Westgard or custom rules. | Highlights analytes that missed QC testing based on expected frequency. |
Lab Management Impact
Incorporating the QC dashboard into users' daily routines can significantly reduce time spent on QC issues and manual tracking, while improving result reliability. The timeline below illustrates the impact of consistent QC monitoring at two different labs, enabling more proactive actions, such as more frequent calibrations, which led to fewer violations.
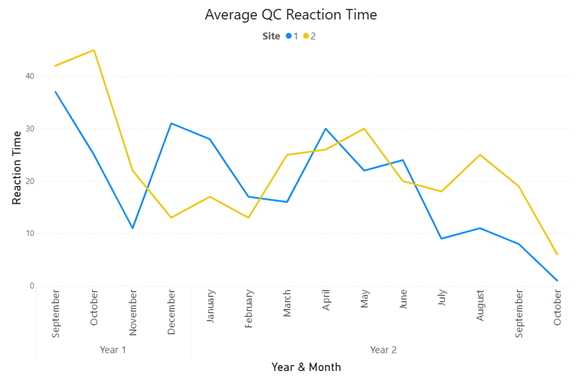
The graph shows a decrease in the average QC reaction time, with a sharp decline over time, indicating significant improvement in response efficiency driven by greater QC visibility.
Coming Up Next
In the next newsletter, we'll unpack each of the dashboard categories in detail, explore how to customise monitoring to your lab's priorities, and share insights from labs using the Skylims QC monitoring tools in high-throughput scenarios.
Support Information
If you would like to review your current QC configuration, our support team is ready to assist. We can offer a guided walkthrough, help configure your QC settings, or provide tips tailored to your specific lab setup.
We're here to help ensure the system is working at its best for your laboratory. Whether you're refining your QC strategy or setting up for the first time, don't hesitate to contact us.
Email: support@mukon.co.za
Tel: 012 450 0240
References:
-
Westgard Rules. Link: Westgard Rules | Multirules by James Westgard - Westgard QC
-
Clinical and Laboratory Standards Institute (CLSI). C24: Statistical Quality Control for Quantitative Measurement Procedures: Principles and Definitions, 4th Edition; EP23-A: Laboratory Quality Control Based on Risk Management, Approved Guideline.
-
International Organization for Standardization (ISO). ISO 15189:2022 Medical laboratories – Requirements for quality and competence, Clause 5.3.2. Link: ISO 15189:2022(en), Medical laboratories — Requirements for quality and competence